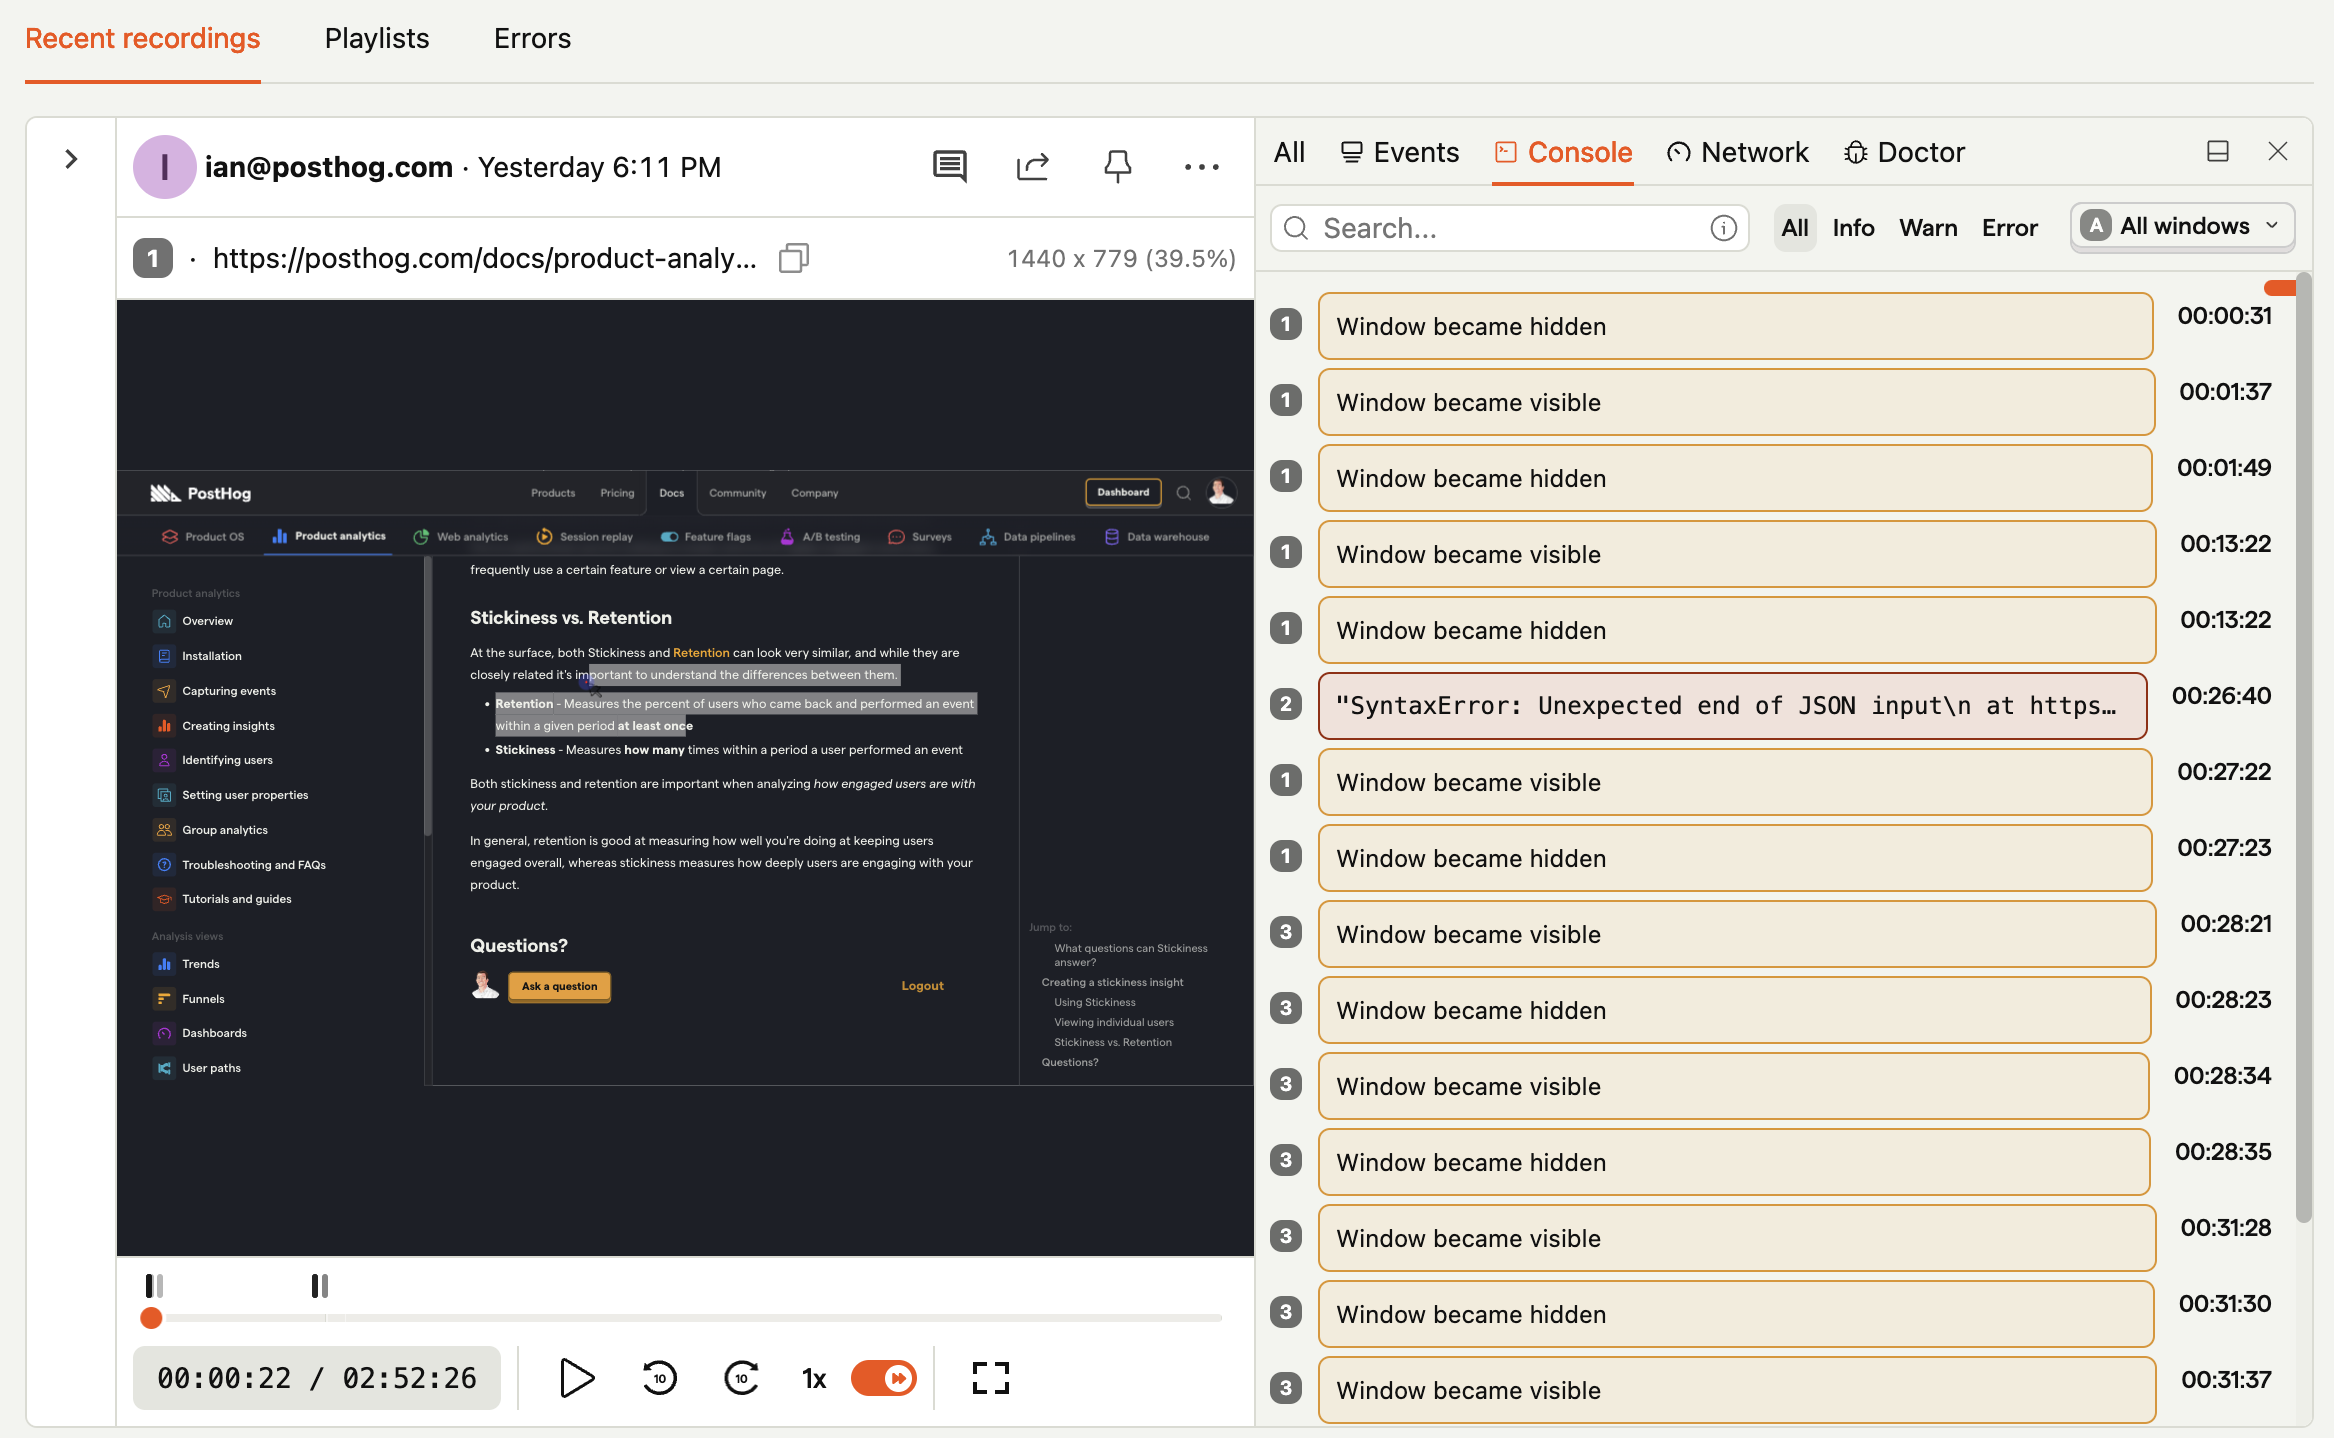
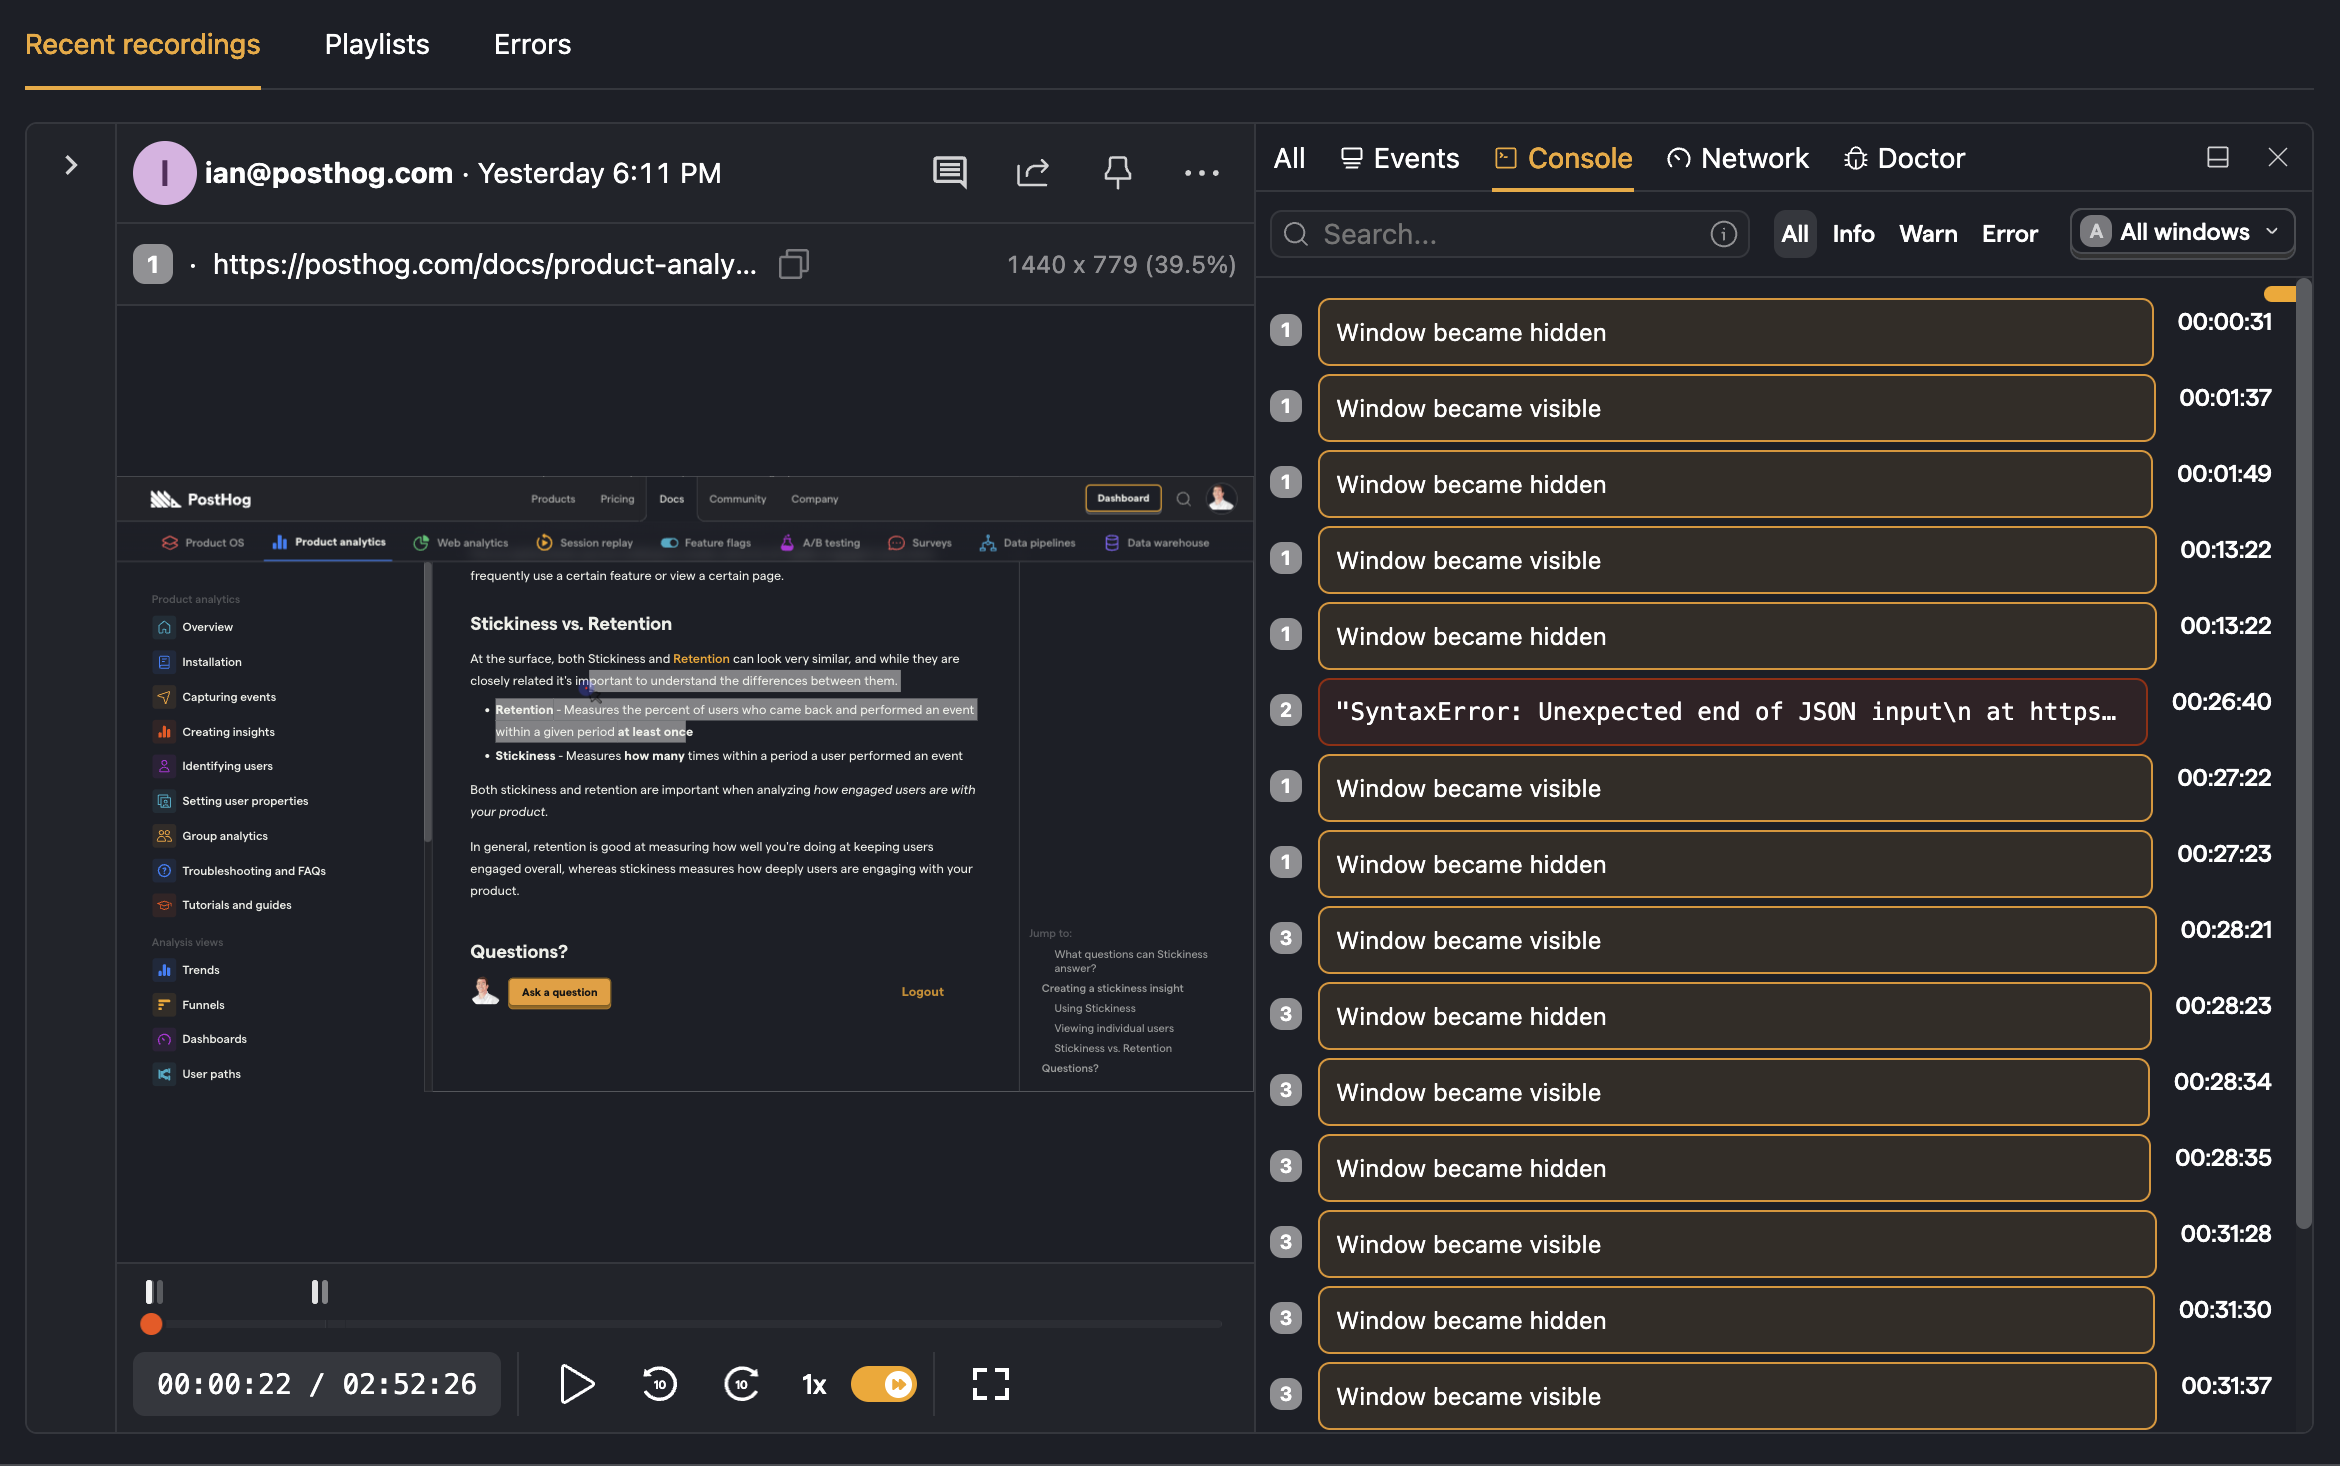
PostHog can capture console logs, info, warnings, and errors from your application. This is useful for debugging and providing extra context on what is happening in your user's browser or mobile device environment.
As console logs can contain sensitive information, we do not capture these logs automatically. You can enable this feature globally either from your project settings or client-side by setting enable_recording_console_log: true in our JavaScript Web SDK config.
Important: Individual console logs are truncated at 2000 characters. The rest of the log is not sent to PostHog. When truncating a log message we add
...[Truncated]to the message.
Viewing and searching console logs
Once enabled, you can then view captured console logs by clicking the "Inspector" button and choosing the console tab.


In that tab, you can search for specific logs with the following patterns:
| Token | Match Type | Description |
|---|---|---|
jscript | fuzzy-match | Items that fuzzy match jscript |
=scheme | exact-match | Items that are scheme |
'python | include-match | Items that include python |
!ruby | inverse-exact-match | Items that do not include ruby |
^java | prefix-exact-match | Items that start with java |
!^earlang | inverse-prefix-exact-match | Items that do not start with earlang |
.js$ | suffix-exact-match | Items that end with .js |
!.go$ | inverse-suffix-exact-match | Items that do not end with .go |